Reporting Season FY2014 – Dividends Glorious Dividends!
Welcome to the fourth issue of the BKI Quarterly Report. We’ve enjoyed your feedback from
the Reports thus far and we will continue to focus on important matters involving BKI. In this
edition we will give an overview of how we saw the FY2014 Reporting Season and provide
commentary focused on the stocks and sectors that we thought stood out.
Reporting Season is usually a very busy period for fund managers and analysts as well as
company boards and management teams. It’s a brief window where companies present either
full or half year results to shareholders, offer guidance for the next six or twelve months and,
for the better quality companies, a great chance to reward their shareholders with another fully
franked dividend distribution.
Since listing, BKI has experienced some 23 reporting seasons. Each one has emerged with a
theme that will quite often differ from the last, even though they are only six months apart! The
fact that the broader market can change course and refocus on a different theme every six
months highlights to Will and I just how short term the market can be. We can assure you
however, that we don’t manage your money for six month trends, but rather for the long term,
and by this we mean ten-to-twenty years plus. We will see many a theme over this timeframe,
and that is why we continue to focus on holding good quality, well managed, income producing
companies who can weather any storm, any trend or theme over the investment timeframe.
From stocks within the BKI portfolio who have reported thus far we have seen an average growth in Earnings Per Share (EPS) of 10.2%, above market expectations of 7.2% growth. Cost outs was again a priority for management during FY2014, enabling sound profit and EPS growth. This growth coupled with the recent inflows of SMSF money into Australian Equities formed a clear theme for the FY2014 Reporting Season…“Capital Management” (the distribution of dividends, franking credits, special dividends, share buy backs and capital returns).
So the entire market is now focused on capital management, dividends and franking credit distributions? That’s great, but the traditional LIC’s have been investing in stocks focused on distributing dividends and franking credits for decades, generating significant shareholder wealth by investing in solid companies in a very cost effective manner. Its been an income bonanza for traditional LIC’s, being spoilt rotten for yield and franking credits for many years now. Even the core BKI portfolio when set up in the mid 80’s was invested in stocks who produced a sound and growing dividend: National Australia Bank, Wesfarmers Limited, BHP Limited, Westpac Banking Corporation, Milton Corporation just to name a few.
This sudden focus on capital management has been part of the DNA and make up of traditional LIC’s for a long time and through all cycles. Remember December 2008, when the Commonwealth Bank of Australia conducted a capital raising at $26.00 a share? Or Westpac Banking Corporation’s share placement at $16.00 per share? Or in January 2009 when Wesfarmers Limited completed an entitlement offer at $13.50 per share?
We hope the trend of investing in stocks who are producing an attractive fully franked dividend now continues into the future. Investing into stocks for income purposes should be a long term theme, not done with a six month window of opportunity. Some six years post the Commonwealth Bank capital raisings, shareholders in this recent reporting season were paid a fully franked final dividend of $2.00 per share (that final dividend alone represented a yield of 7.7% on money invested in 2008). Wesfarmers shareholders in this period have been paid a fully franked final dividend of $1.05, a $0.10 fully franked special dividend and will be entitled to a capital return of $1.00 per share (these dividends and distributions represent a yield of 15.9% on money that was invested in 2009).
There was, however, more to like this reporting season than just the Wesfarmers and Commonwealth Bank results.
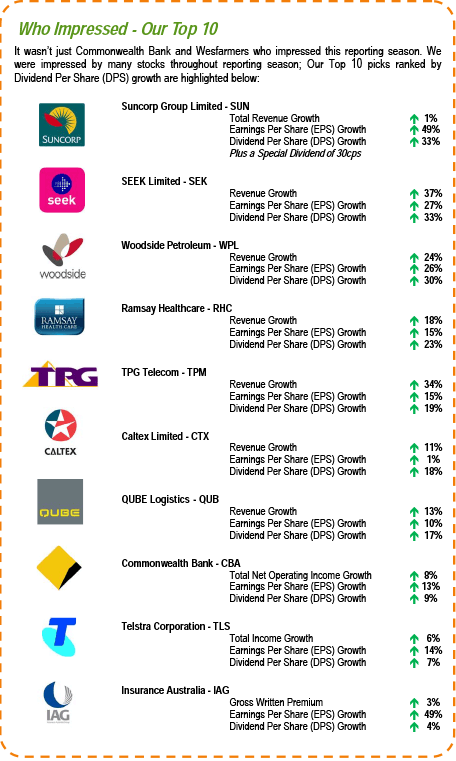
Top 10 Stocks
FY2015 EPS Outlook
We have seen stocks in BKI’s portfolio this reporting season grow EPS by an average of 10.2% (above the markets expectations of 7.2%). As we have discussed, revenue growth was difficult to achieve and company managers were forced to focus on cutting expenses to ensure they delivered better results this reporting season, and thus increased dividends. If the low interest rate environment remains, retail investors and SMSFs will continue to search for income outside of term deposits and other cash products, placing pressure on companies to continue to focus on capital management.
Companies across our market are in an interesting position. The cost out strategy can deliver results for a while; however, unless the top line of a company is growing then eventually the music has to stop. EPS therefore weakens, forcing dividend pay out ratios to stretch, and if this continues for a period then ultimately the company will be forced to cut their dividend.
Many investors are calling our market overvalued and we agree that some companies appear stretched on their payout ability. However, we believe for the long term investor opportunities to deploy funds into well managed, profitable, dividend paying stocks always exist – one may just have to look a bit harder sometimes. For the broader market, next year is already looking a bit brighter. According to Bloomberg consensus EPS, the S&P/ASX200 Accumulation Index is forecast to grow at 9.8% in FY2015, whilst forecast dividend yields are at 5.1%.
Principal Activity
As confidence within the economy improves we should see the broader market benefit from this recent cost out program. Until this confidence returns, we want to share our views on the sectors that we like for the longer term.
As part of BKI’s long term investment criteria one of our key fundamentals in stock selection is Principal Activity. When we analyse a stock at this step we ask ourselves a few basic questions:
“Do we understand what this company does?”
“Does this company have a sustainable business model? Will this company be around for the long term?”
“Does the business have a competitive advantage?”
These questions seem basic, almost embarrassingly so, but the truth is if we answer “NO” to any of these the reality is that it may well be a poor investment – maybe not today but some time down the track. To
answer these questions we need to combine our bottom up stock selection process (including looking at the balance sheet, dividend payout ability, valuations, management and board) with a broader sector and industry overview.
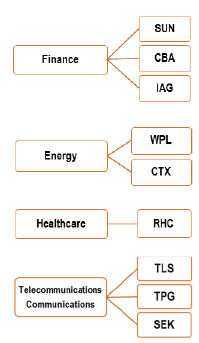
If we focus on the stocks listed on page 2 of this Quarterly Report we can quickly identify the sectors and industries in which these stocks are flourishing. As you can see by the graphs on the right, nine of the ten stocks listed on page 2 have an exposure to four sectors;
Finance
Energy
Healthcare
Telco/Communications
We are excited about these sectors and are comfortable deploying funds here over the longer term. We will expand further on our views of some of these sectors over the page.
Finance
Stocks within the financial sector delivered some healthy results this period. We saw CBA grow Cash NPAT by 13%, EPS by 13% and annual DPS by 9%. SUN reported NPAT growth for their General Insurance business by 14%, whilst Bank NPAT totaled $228m (a significant improvement on last year’s loss of $343m). SUN delivered Ordinary DPS growth of 33% and paid a 30cps Fully Franked Special Dividend. IAG’s NPAT was up 59%, with Insurance Profits rising 11%. EPS was an impressive 49% higher than last year with DPS growth continuing. Other stocks who posted solid results within the Financial Sector were IOOF Limited, ASX Limited, AMP Limited, Equity Trustees and Bendigo Bank.
Global financial conditions have continued to stabilise over the past year. Australian banks have been a beneficiary of this improvement and we saw this come through in lower bad debt expenses in the CBA result. We also saw CBA’s consumer days in arrears for credit cards (+30 days) and mortgage loans in arrears (+90days) at historically low rates. We continue to like the attractive banking industry dynamics and we like CBA for their robust business model and competitive advantage.
Management are also held in high regard, are forward looking, continually investing for the future (CBA’s total investment spend for the last two years has been $2.4bn). CBA remain the only Australian bank to have real time systems and an onshore back office, enabling them to capture over 5m active online customers, a very important factor going forward. It is estimated that the costs of having a customer transact online (via a PC, tablet or smart phone) is 1/50th that of a manual transaction (bank visit + cheque).
The press were scathing of insurance companies after the large catastrophes experienced between 2009 and 2012. SUN for example were exposed by $993m of claims over their estimated allowances made for natural hazards (Cyclone Yasi, Victorian bushfires, Queensland Floods, and the Christchurch earthquakes). We believe that IAG and SUN have come through this period well and have compensated those unfortunate customers that were involved in each of these events. Most of the public now realize that the role of the insurer is a very important one. According to APRA, of the 115 insurers licensed to conduct general insurance business in Australia, the Total Net Incurred Claims for the industry in FY2014 was $19.2bn, up 7.4% from last year. Whilst much of the improvement this year in premium growth rates was due to the favourable natural hazard and investment environment, the strong results posted by IAG and SUN can also be attributed to the positive steps over the last two years of divesting underperforming businesses, improving operating models, pricing, investing in technology and reducing overheads. Between IAG and SUN (the 2nd and 3rd largest general insurers in Australia), their reported Net Earned Premiums in FY2014 represented over 50% of the total industry in Australia.
Companies such as CBA, NAB, WBC, ANZ, SUN and IAG are viewed as standout investments within this segment. They are also highly regulated by APRA who provides investors added protection by minimising the probability of these institutions failing and to ensure a stable, efficient and competitive system.
Energy
WPL announced a strong interim result with NPAT 27% higher to $1.1bn and EPS 26% higher to US$134cps. Recent trends of excellent free cash flow and better than expected dividends continued, enabling WPL to lift the interim dividend from USD$83cps to USD$111cps. However earnings that are returned rather than reinvested could, in the absence of acquisitions, see WPL experience a significant slowdown in production and thus dividend payouts.
CTX’s Marketing & Distribution division again carried the company, recording EBIT growth of $393m, up 8% on last year. The Refining & Supply division delivered further losses ($65m versus $43m last year). CTX’s strategy going forward is to grow earnings, reduce volatility of earnings and increase balance sheet flexibility to maximise longer term shareholder returns. The Refining division doesn’t fit in with this strategy and thus we will see them transition Kurnell from a refining operation to an import terminal. The closure remains on time and on budget and is set to commence from October 2014.
Despite petrol volumes in Australia falling and LNG, CSG and coal mining coming under attack from environmental activists, we remain positive on the long term earnings growth forecasts of parts of the energy sector. Will and I have been busy trying to get a sense of the winners and losers from the LNG boom and we’d have to say that some of the data we’ve compiled tells a potentially scary story. We were told by one analyst in the industry that the Gladstone LNG project was nothing more than a “$70 billion experiment that has no winners”. There is no shortage of gas on the east coast of Australia – just a shortage of economic gas. LNG operators during project feasibility signed substantial take or pay agreements and now they simply do not have enough gas to meet these export contracts. The fear now is that they will be required to buy domestic gas to satisfy their requirements, forcing local gas prices higher (from ~$3/GJ up to forecasts of ~$10GJ).
As stated earlier the market is focused on any stock producing a yield. Within the energy sector FY2014 and FY2015 the Free Cash Flow opportunity lies with Woodside. Out from FY17, the market is focused on increased dividends from Santos, Oil Search and Origin Energy. Having looked harder at the sector we’ve become a wary of the markets obsession with “Free” Cash Flow verses “Operating” Cash Flow. This is a game for the big boys (the largest oil & gas players continue to spend 100’s millions of dollars each year on exploration and operating capex), and Australia’s oil and gas companies have significant future “Stay in Business” capex requirements that may take the “free” out of their cash flows and investors dividends.
So how are we going to play the energy space? It may be too early, but building these LNG projects ORG and STO may well be betting too much of the farm on the outcome, and unless WPL invest further on exploration and expansion they may well run out of earnings to support their current dividend yield. However, despite the prices and volumes available for export markets, the gas will still need to be transported across the country to their terminals; key players in this space include APA and DUE, and we’re confident they will be very profitable businesses over the long term.
 This is a very interesting sector at present with the thematic of population growth and further urbanization a real driver for consumption of energy requirements. According to the International Energy Agency, 18% of the world’s population still has no access to electricity at all and 38% are still dependent on wood, crop residues and animal waste as their main fuel for cooking and heating. It remains a fact that individuals and businesses simply can’t afford to pay too much for energy. In the developed world individuals have switched to Diesel as an economic alternative within the automotive sector. Energy providers have switched from coal to gas and in some countries to nuclear and other alternatives.
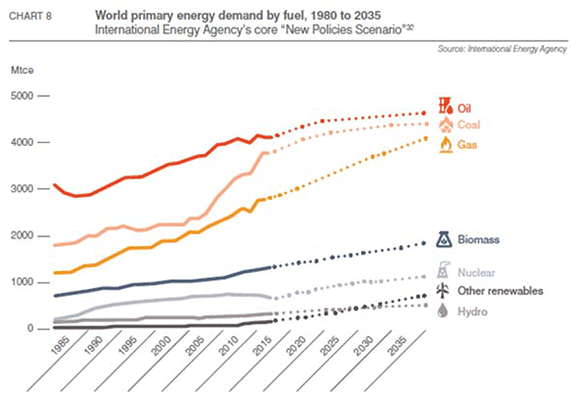
However, as we have seen with the cost of building and using alternatives, the devastating result of the Fukushima disaster in Japan (where all 48 nuclear power plants continue to be mothballed with twelve old plants to remain closed permanently) and Australian domestic gas prices forecast to trade at ~$10GJ, there is a compelling argument that businesses and energy providers will need to switch back to using more coal. The chart above from the International Energy Agency shows forecast world coal consumption growing to ~4,400Mtce by 2035, 4X more than nuclear, Hydro and other renewables.
As the Minerals Council of Australia stated in their publication of “Coal Hard Facts” – “Thermal coal – accounting for 41% of all generation – because it is reliable and affordable. The underlying trend of rising world coal demand, driven by Asian industrialisation and electrification will persist for decades”. Whilst all energy sources will be needed to fill the energy requirement gap, the world’s cheapest, most versatile and abundant fuel is still coal. We continue to like BHP, WES and NHC within this space for this reason.
Healthcare
RHC reported another very strong result with Group Revenue up 18%, EPS up 15% and the Final Dividend of 51cps up 23%. RHC also announced FY15 guidance for the group for core EPS growth of 16%. This year marked RHC’s 50 years of association in the private hospital industry. RHC’s strong results over the years have been driven by solid operating performances (from both their domestic and global businesses) as well as being buoyed by attractive market fundamentals. They are one of the world’s largest private hospital operators with 212 hospitals across five countries, 25,000 beds and places and admit over 2.5m patients each year.
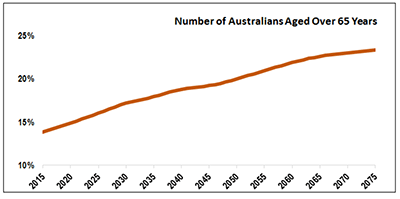
Increasing life expectancy in Australia and most other developed countries, has led us to constantly discuss the aging population thematic and the investment opportunities associated within it. The ABS figures used in the chart on page 6 shows the projections for growth the number of Australians over the age of 65. Over the next several decades, our aging population is projected to have significant implications for Australia in many spheres, including health, labour force participation, housing and demand for a skilled workforce. Given this thematic and our long-term investment horizon, it seems essential that BKI has a significant exposure to the sectors involved with an aging population, and in particular the healthcare sector. According to the Federal Governments “Australian Hospital Statistics” publication released on 30 April 2014, there were 1,338 hospitals in Australia in 2013. The 746 public hospitals accounted for about 68% of hospital beds (58,300) whilst 592 private hospitals accounted for about 32% of beds. There were over 9.3m total separations from hospitals for admitted patients in 2014, with 5.5m in public hospitals and 3.8m in private hospitals (“separation” or “sign out” is the most commonly used measure of the utilization of hospital services). Day-only separations from private hospitals for the year to 30 June 2014 were up 8% versus overnight admissions (both private and public) up only 4%. These numbers suggest that whilst private hospitals account for only 32% of total beds, they are accounting for 41% of total separations. It is expected that the growing utilization of beds within private hospitals will continue with more and more patients undergoing day surgery, benefiting from advances in surgery, technology and post operational care.
The same report suggests that adjusted for inflation, public hospital expenditure increased by an average of 5% over the last five years to reach over $42bn last year. Although it is difficult to quantify total investment by private hospitals, there are a few factors to suggest that private hospital investment will also grow into the future. An aging and growing population is one thing, however, if we also look at increasing wealth, and growth in private health insurance coverage, we can paint a clear picture. There are now more Australians than ever with private hospital cover, which will place an increasing burden on national healthcare systems going forward. Under this scenario private hospital operators like RHC can invest heavily into the sector knowing that utilization rates can grow and returns on investment will be very rewarding. In 2014 alone RHC allocated over $800m on acquisitions and expansions and is also in the process of tendering for the new Northern Beaches Hospital.
Interwoven within the hospital system and aging population thematic are companies such as Primary Health Care (PRY) and Sonic Healthcare (SHL). Providing services both for and independently of hospitals, their volumes in Diagnostic Imaging, Pathology and Radiology offerings will increase significantly going forward. Primary Health Care Medical Centres and Sonic’s Independent Practitioner Network both provide patients with affordable and accessible health care, taking minor accidents and emergency cases away from an already congested hospital system. In addition to this, 80% of Australia’s major hospitals use PRY’s online content and information resource systems. The up-coming IPO of Regis Healthcare could also offer an attractive investment opportunity due to exposure to Australia’s population over the age of 85. This age group is the fastest growing segment of the population and expected to double in size by 2032.
Telco/Communications
TLS delivered a very strong result with EPS up 14%, well ahead of market expectations. DPS was 15cps, again ahead of market expectations. The result delivered across the board – free cash flow of $7.5bn was 5% better than last year, Return On Equity improved to 32% and gearing fell 7.5% to 43%. Overall, this result was pretty hard to fault. TPG too delivered another strong result that was ahead of expectations and even updated guidance given only 4 months ago, EPS was 15% higher and the full year dividend of 9.25cps was 19% higher than FY13. SEK grew Net Profits by 27% and DPS by 33% (DPS has grown from 14cps in FY11 to 30cps in FY14 and is expected to grow to 61cps by FY17).
Infrastructure and/or content in this space is key and TLS, TPG and SEK deliver this in spades. TLS is a clear leader in ownership of Telco infrastructure and has over 16m mobile services, 7.5m fixed voice services and 3m retail broadband services. TPG’s nation-wide network is made up of Australia’s largest internet exchange and third largest metropolitan fibre optic network. SEEK’s Domestic business experiences 30m monthly visits to its website (50% via a handheld device), whilst International record 325m monthly visits.
Forget the next theme or trend the market becomes fixated on. We invest for the long term, through profitable dividend paying companies that we understand and are supported by a long term thematic. We will continue to invest your funds with a clear focus on generating an increasing income stream for distribution to shareholders as fully franked dividends.
Tom Millner, October 2014
Original Article PDF can be downloaded here
The material contained within the BKI Investment Company Limited Quarterly Report (The Report) has been prepared by BKI Investment Company Limited. Figures referred to in The Report are unaudited. The Report is not intended to provide advice to investors or take into account an individual’s financial circumstances or investment objectives. This is general investment advice only and does not constitute advice to any person. The opinions within The Report are not intended to represent recommendations to investors, they are the view of BKI Investment Company Limited as of this date and are accordingly subject to change. Information related to any company or security is for information purposes only and should not be interpreted as a solicitation of offer to buy or sell any security. The information on which The Report is based has been obtained from sources we believe to be reliable, but we do not guarantee its accuracy or completeness. Investors should consult their financial adviser in relation to any material within this document.