Why Reinvestment is Important
Welcome to the eighth issue of the BKI Quarterly Report. This report, and previous issues, are available on our website at www.bkilimited.com.au. While we intend to cover a few topics on capital allocation in this report, a main focus for us leading up to and during the recent reporting season has been looking at our investments and ensuring management are reinvesting for future earnings. We want to invest in great companies, that produce quality and growing earnings and pay quality and growing dividends. Some management teams achieve this greatness, but unfortunately some management teams do not. There are many capital allocation levers to pull when trying to achieve earnings growth.
Let’s start with the outcome and work backwards – dividends. It is true to say that the most sought-after equity investments in Australia for many years, but particularly the last 2-3 years, have been those stocks which offer a high fully franked dividend. Build it and they will come. Pay dividends and yield motivated shareholders will buy your shares; they may even lose sight of the valuation of those shares for a period. Sounds relatively straight forward; however, we believe in many cases the point has been missed. Dividends don’t just happen, they are the outworking of many years of hard work. Just because a stock pays a dividend today does not mean they will continue to do so into the future.
In our FY2015 Media Release lodged with the ASX on 24 July we made the point that we were concerned that some stocks may begin to struggle to offer a consistently high income stream to these yield motivated shareholders. Revenue growth looks flat at best for many stocks let alone earnings growth – that seems difficult within this market. If shareholders continually invest in stocks that pay out over 100% of earnings it will simply end in disappointment, it has to.
Let’s focus on how some management teams generate long term earnings growth. Some do it through acquisition, some by cutting costs, others conduct share buy backs. And some do it by actually running the business well, reinvesting for the future, accepting and implementing technology changes, maintaining a strong balance sheet and holding onto, as if their life depended on it, any competitive advantage that the business has now and well into the future. Let’s start by firstly looking at the cost cutters.
Cost Cutting
As we thought would be the case with many stocks within our market, revenues declared during this reporting season were flat. Managers who have been forced to focus on cutting expenses to ensure they deliver increased dividends to their shareholders have now exhausted this option. This cost out strategy has been appropriate in recent years for many companies simply because technology and systems have improved, making businesses more efficient and able to be run leaner.
It’s the stocks that have been living above their means that we become concerned about. Desperate management teams will continue to target a reduction in capital expenditure (capex) to help maintain the earnings growth profile. However, cutting capex doesn’t just mean pulling funding for a multibillion dollar project, as we are seeing within the resource sector. Capex is also capital necessary to maintain the current business including investment for growth in future years.
Cutting capex at the cost of reinvestment really concerns us. Most great companies within our market have always invested back into their business. Reinvest today in a good business with the view that tomorrow’s business is going to be great. Now they’re the stocks you want to own in your portfolio!
So how do you find these stocks? One quick measure that we use is the free cash flow generation. Remember that capex is also used to reinvest back into the business, its not just capital allocated to a project.
Free cash flow = (operating cash flow – capex)
So great stocks have positive free cash flow (after reinvestment), they will be making profits and they will have paid tax. These great stocks are now in a position to pass on dividend distributions to shareholders with franking credits attached.
Unfortunately we are also seeing many managers using this free cash flow as a means of buying back the company’s shares and we often think that is a bad move. We prefer dividends, particularly franked dividends to buy backs.
Buy-Backs
When we see companies announce large buy backs we do get a little concerned and ask ourselves a few questions:
- Is this management’s way of saying that there is a lack of opportunity for business investment?
- Why don’t they just pay shareholders a special dividend?
- Do they just want to do this to maintain or increase EPS? How aligned is the management team? Do they want the EPS to go up so they can earn their short term bonus?
- Is it the right time in the cycle to conduct a buyback? Are the shares really that cheap?
- Are they taking on debt to buy their own shares back?
To put it bluntly, we as shareholders and part owners of a business, pay management teams to invest for the future; to create wealth for us and to distribute dividends… not ensure they reach internal EPS hurdles so they can then pay themselves large short term bonuses and then ride off into the sunset. US businessman and investor Mohnish Pabrai once quoted Charlie Munger as saying “look at the cannibals.” Meaning that if businesses continue to buy back large amounts of their own stock they “eat themselves away”. Not a bad analogy and one that rings true even with BKI. For many years some investors tried to encourage us to conduct a buy back in a quest to reduce our discount to NTA. However we decided that we would continue investing in quality stocks, paying dividends to BKI shareholders and also reinvest back into our business. Today BKI usually trades at or above the pre-tax NTA and has a market cap of almost $1bn.
Without being too critical and with the benefit of hindsight, it’s worth going back quickly to see how some of the larger companies have traded after conducting significant share buy-backs. There is no consistent evidence here to suggest that they work and its important to see who the buy-back is the most attractive to. In many cases its not attractive for the long term shareholders who want to stay invested in the stock.
- In 2014 Telstra Corporation conducted a $1bln share buyback at $4.60. $2.27 of the buy-back price was treated for Australian tax purposes as a fully franked dividend. Shares in Telstra at 31 August 2015 were trading at $5.77 – too bad if you had sold your shares at $4.60, you’d have left a $1.00 of capital and $0.30 of fully franked dividends on the table.
- In 2011, BHP Billiton announced a $6bln Off-Market buyback, with the Market Price for the tender (as defined in the Buy- Back booklet) at $47.50. $40.57 of the Off-Market buyback Price was treated for Australian tax purposes as a fully franked dividend. As at 31 August 2015 BHP Billiton shares were trading at $25.18 – We can’t really say the management team at the time picked the resource cycle can you?
- During 2010, Woolworths Limited “returned” more than $1bln to shareholders via on-market and off-market buy-backs.
The $704m off-market buy-back was priced at $25.62 and for Australian tax purposes $22.54 was a fully franked dividend. As at 31 August 2015 Woolworths shares were trading at $26.40 – imagine if Woolies introduced a $1bln supermarket refurbishment incentive in 2010 as opposed to 2015, Aldi wouldn’t have stood a chance! - In 2005 Coles Myer undertook a $585m Off-Market share buyback, which acquired 70.4m shares or 5.7% of the stock on issue – from investors at $8.30 a share. For tax purposes $5.30 was treated as a fully franked dividend. Two years later Wesfarmers acquired Coles Myer for over $15 a share – The $8.30 represented good value for the company to buy shares back, but was a long way short of good value compared to the acquisition price!
Why companies who continue to reinvest will win.
As we’ve stated on numerous occasions we prefer to buy stocks that have strong dividend growth, and are reluctant to chase stocks just offering high yields that we don’t think are sustainable. Stocks that reinvest back into their business for future growth is so important when supporting this investment requirement. However reinvestment does go further. In 2007 in a letter to shareholders, Warren Buffett stated that “A truly great business must have an enduring "moat" that protects excellent returns on invested capital. The dynamics of capitalism guarantee that competitors will repeatedly assault any business "castle" that is earning high returns."
So when a “good” business becomes a “great” business it still can’t just sit there idle, it needs to keep reinvesting to grow profits and future dividends. But as Buffett puts it, they also need to do it to protect their “castle” against competition. There are companies within the BKI portfolio that do this and have always done this. We will talk about a few that have an “enduring moat" that protects returns on invested capital. Management are not happy to just stand still, patting themselves on the back; they will continually invest in their business to ensure that competitors find it more and more difficult to “assault their business castle".
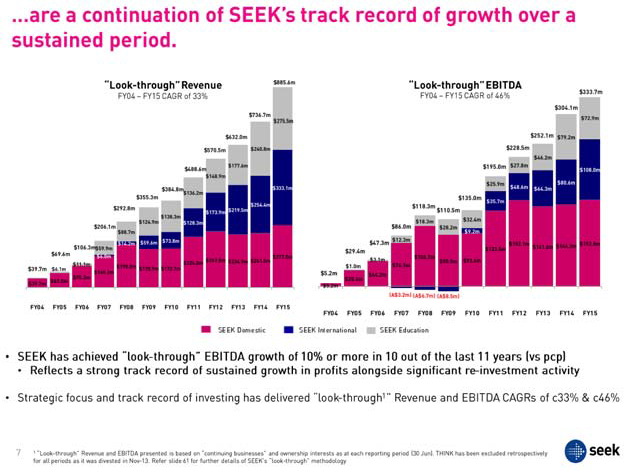
SEEK Limited (SEK). SEK announced their FY15 Full Year Results to the market on 19 August 2015. In the Media Release the MD Andrew Bassat said, “We are very pleased with revenue growth of 14% achieved despite subdued macro conditions. The record revenue result can be attributed to SEK’s strong market position and re-investment in product and technology which is delivering strong outcomes for hirers and jobseekers. Our significant re-investment in product and technology has delivered over 35+ product and service enhancements in the last 12 months and has strengthened our platform.”
SEEK has delivered average compound growth rates in revenue of 33% and NPAT 46% over the last 12 years, as can be seen from Slide 7 of their FY2015 Presentation below. Average EPS growth of 14%pa over the last five years has enabled SEK’s dividend to grow from 11.9cps in FY2010 to 36cps in FY2015.
ASX Limited released Full Year results to 30 June 2015 to the market on 20 August 2015. Despite ASX having a clear majority of market share in the Australian market (>90%), capex spend for FY15 was $44m driven by ongoing investment in core services and the construction of the Customer Support Centre. As part of its ongoing technology investment program the ASX expects capital expenditure in FY16 to be in the range of $45m-$50m. The technology program will “improve the ability of the exchange to innovate and bring products to market quickly, make it easier for clients to connect to ASX and reduce their internal operating costs.” Mr Elmer Funke Kupper, ASX Managing Director and CEO, said “ASX is excited by the potential its investment program has to deliver efficiencies to customers, provide product and service innovation, and ensure Australia’s market infrastructure remains world-class.”
ASX’s average total capital expenditure since 2011 has been $43m per annum. Since this annual capex spend has been implemented ASX has delivered three year average NPAT growth of 6%pa with dividend growth of 5%pa.
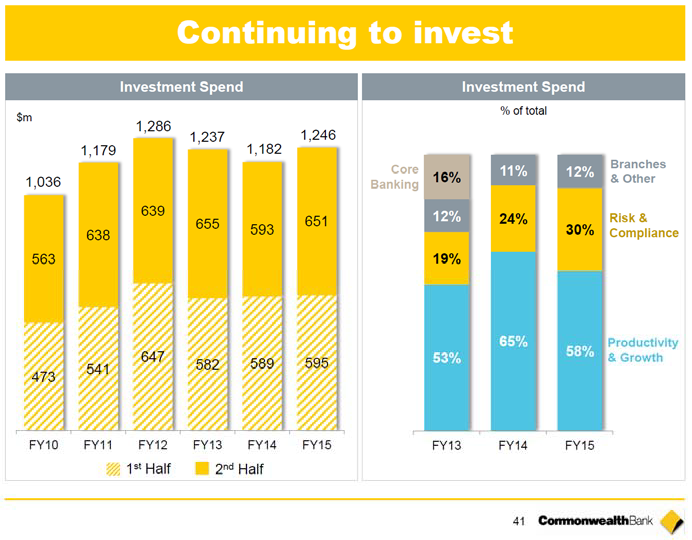
Commonwealth Bank announced on 12 August 2015 with the headline of their Media Release stating “Long term strategy delivers continuing customer satisfaction and profit growth”. Despite having significant market share and a Market Cap of over $130bn they again continued to invest in the long term growth of the business, with further capital invested on initiatives including risk, technology and productivity. CBA has spent an average of $1.2bn pa on Investment Spend over the last five years. Over half of this is focused on improving productivity and growth, as can be seen in the picture below, from slide 41 of the Results Presentation for the Full Year ended 30 June 2015.
Group Chief Executive Officer, Ian Narev made the following comments in the Media Release: “At CBA we will continue our significant investment in our long-term strategic priorities.” “Technology again featured strongly in the high levels of investment that we maintained throughout this financial year. Our focus remains on the use of technology to improve all our channels, and to underpin continuous process improvement, to simplify our customers’ experience with us.”
On 27 August 2015 Ramsay Healthcare MD Christopher Rex stated in their release that “One of our key strengths is our ability to create shareholder value through financially disciplined capital investment in our existing facilities. In fiscal year 2015 we completed $190 million worth of new brownfield developments, ensuring our facilities are up-to-date for patients, and providing our staff and doctors with the latest medical equipment.”
Despite this significant investment, Ramsay Healthcare was able to post a 19% lift in Net Profits After Tax, a 20% lift in Earnings Per Share and a 19% increase to full year dividends paid to shareholders. “Our comprehensive and sustainable growth strategy has positioned Ramsay Health Care as one of the largest and most successful private hospital operators in the world,” said Mr Rex. We believe that it’s this constant re-investment back into their business that has allowed Ramsay’s dividend to grow 33%pa over the last five years.
Compounding
Companies don’t have to be the only ones to redeploy capital back into themselves. Individual reinvestment, or compounding, is something we always try and encourage shareholders of BKI in “accumulation phase” to consider. If a shareholder chooses to reinvest the dividends they receive into buying more BKI shares, sometimes even at a discount, your investment can grow quite rapidly – because those dividends are also now starting to make money. The chart “Income Growth” on the following page highlights this point. We’ve used this chart in presentations to shareholders for many years now, and each year it gets better and better as the compounding effect starts to blossom and bear fruit.
An investor who spent the equivalent of $100,000 to purchase BKI shares upon listing in 2003 would have received dividends of
$11,242 in FY2015, as shown in the Orange bars. These figures include the reinvestment of all dividends and assumes a tax rate of 30%. The franking credits enhance the income even further, as shown in the Blue bars. The same investment in a term deposit
(based on the cash rate) would have earned pre-tax interest income of $4,746 with no franking credits.
Income Growth ($Australian Dollars)
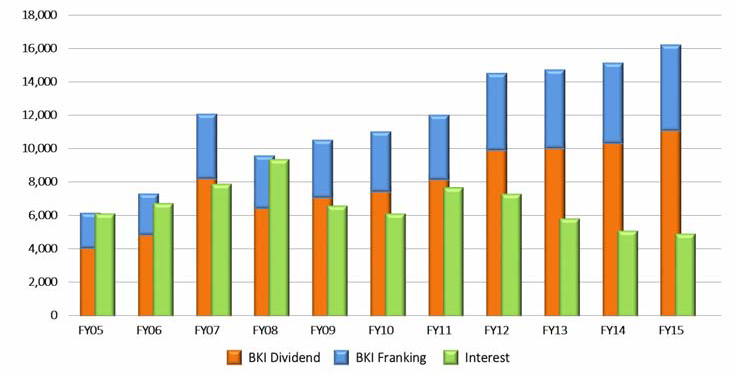
The benefit of compounding is clearly seen in this chart. In an environment where income hungry investors are looking for yield, the income received from BKI dividends in FY2015, compounded and reinvested from IPO date, represents a very attractive fully franked yield. This ignores the capital appreciation of BKI shares since listing date.
Our aim is to create wealth for BKI shareholders, through an increasing fully franked dividend and capital growth. We can achieve this by investing in great stocks, who produce quality and growing earnings and who pay quality and growing dividends. As we’ve discussed, some stocks achieve this greatness through the appropriate reinvestment of capital by sensible management teams. It’s those long term focused managers who we like to follow and invest alongside with, managers who are reinvesting for future earnings to shareholders, even if the company is a clear number one, has significant market share with high barriers to entry. If they stop reinvesting today the dividends will eventually slow and may even stop. And no one wants that.
Tom Millner (September 2015)
The material contained within the BKI Investment Company Limited Quarterly Report (The Report) has been prepared by BKI Investment Company Limited. Figures referred to in The Report are unaudited. The Report is not intended to provide advice to investors or take into account an individual’s financial circumstances or investment objectives. This is general investment advice only and does not constitute advice to any person. The opinions within The Report are not intended to represent recommendations to investors, they are the view of BKI Investment Company Limited as of this date and are accordingly subject to change. Information related to any company or security is for information purposes only and should not be interpreted as a solicitation of offer to buy or sell any security. The information on which The Report is based has been obtained from sources we believe to be reliable, but we do not guarantee its accuracy or completeness. Investors should consult their financial adviser in relation to any material within this document.