Welcome to the third issue of the BKI Quarterly Report. We hope you are enjoying these publications as we continue to focus on important matters involving your company such as franking credits, dividends and portfolio positions. In this edition we look to address one of the main questions we are getting from investors…“What do you think about the Banks?”
Tom and I get this question regularly and with good reason. The “Big Four” banks have been standout performers in recent years and have a dominant weighting on the Australian Securities Exchange. Between them, the four majors (ANZ, CBA, NAB and WBC) constitute almost 30% of the S&P/ASX 200 Index.
The short answer is that we remain comfortable with BKI’s Portfolio’s exposure to the Banks (portfolio weighting to the four majors is approximately 32%). As we explain in this note, all four banks offer the investment characteristics that BKI values. We employ a rigorous investment criteria across our portfolio which we group into five key areas. That is:
Income – Dividend Yields, Income Growth, Franking Credits, Payout Ratios
Principal Activity – Sustainable Business Model, Competitive Advantage
Debt Levels – Gearing Ratios, Net Interest Coverage, Capital Ratios
Management and Board – Share Ownership, Board Meeting Attendance, History of Creating Shareholder Wealth
Earnings and Valuations – Earnings Profiles, PE Multiples, EV/EBITDA Multiples
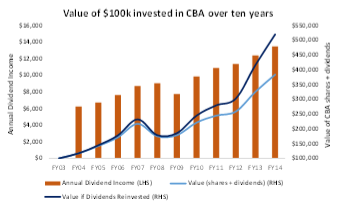
We will explore these issues in more detail below. However, before we look at the specifics of our portfolio positioning in the banks, we think it appropriate to reinforce that we genuinely think very long term in managing the BKI portfolio. We do not over trade the portfolio (turnover is generally only 5%-10% which is very low by industry standards) and prefer to hold good quality, well managed, income producing companies for as long as possible. We believe this approach is the best way to generate shareholder wealth. Bill Gates has been quoted as saying: “Most people overestimate what they can do in one year and underestimate what they can do in ten years”. We believe that most people underestimate how powerful a tool compounding is in creating long-term wealth. By earning returns on your returns, one can build a surprisingly large portfolio relative to the initial contribution.
Consider the value of shares in Commonwealth Bank of Australia (‘CBA’) over the past ten years. If one invested $100k ten years ago in CBA, that person would have collected $104k in dividend income (excluding any franking credits) and would still be holding shares worth $280k today. This year alone, that same investor would have received dividends of $13,447, which represents a grossed-up yield of 19.2% on their original investment. Alternatively, if that person had participated in a Dividend Reinvestment Plan (DRP), that $100k investment only ten years ago would now be valued at almost $520k – a compound average growth rate of 18% per annum!
Consider a further example which considers the total Australian stock market. At the start of this century (less than 15 years ago) the S&P/ASX200 Accumulation Index (i.e. inclusive of dividends) was 15,000 points. Since then, we’ve seen the Tech Wreck, September 11 and the Global Financial Crisis. The S&P/ASX200 Accumulation Index is now trading at over 46,000 points – a tripling! Yet, a lot of people have lost money in the stock market since the year 2000. We do not believe that trying to constantly time the market by trading in and out is a recipe for long-term success. We think it’s far more productive to be confident in the quality of our investments over the long term rather than nervous about the inevitable volatility of the short term.
A Discussion on the Banks
Banks have generally reported increases in underlying profit, reflecting ongoing declines in bad debt charges owing to improved asset quality, and increases in income due to balance sheet growth. For the major banks, net interest margins have narrowed, with banks attributing this to the ongoing effects of lower interest rates and strong competition in lending markets; this has been offset, in part, by reduced competition for term deposits. The banks generally increased their dividends compared with the same period in the previous financial year.
Reserve Bank of Australia Statement on Monetary Policy (May 2014)
In the first half of 2014, in what many experts are calling “benign” economic conditions, the headline profit for the big four banks was a combined $14.8 billion. Interim dividends paid to shareholders totalled $10.4 billion, with the average interim dividend increasing 9% over the previous corresponding period.
Low interest rates are having a positive impact on the demand for household credit in Australia, particularly for investment home loans. However, growth in business loans remains more subdued. The Federal Budget released in May targeted at reducing the country’s deficit was another blow for an Australian business community that is already low in confidence.
We thought it worthwhile to share our views against what the bears on the Banks are saying. There are four main areas of focus:
1) The level of Australian household indebtedness – housing credit now accounts for 60% of total credit, the highest it has been since deregulation.
Housing price growth has been strong over the past three years. In the last twelve months alone, the average Australian home increased in value by 11.5% to just under $650k. Sydney and Melbourne have been very strong with house prices up 17% and 12% respectively. The RBA is not overly concerned with the uptick and notes that “the rise in housing prices over the past year or so is broadly consistent with the historical relationship between interest rates and housing prices”.
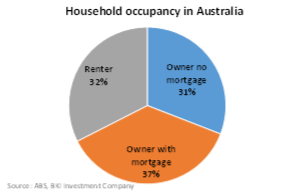
Many pundits point to the collapse in US house prices and are calling a bubble in Australia. The bears argue that the contagion from a significant drop in house prices will obviously be extremely negative for the major Australian Banks. We are less pessimistic and believe that the banks have sufficient cushioning against a significant downturn in house prices, should that occur. We’ve spent some time looking at ABS statistics and note the following:
• There are 9.3 million households in Australia. Almost one-third are occupied by households with no mortgage.
• The estimated value of Australian residential properties is $5.0 trillion (an average price of $539,400). The banks have loans outstanding of $1.3 trillion (average loan per household of $139,280).
• The Australian Bankers Association states that while the average new home loan is $320k, the average home loan outstanding is $232k. The average mortgage rate is 5.2% and the average household is paying $17k per annum in mortgage repayments. The average family is allocating 30% of its disposable income to the mortgage. Mortgage stress is an issue in Australia. However, Tom and I would argue that this poses a greater concern for discretionary retailers than it does the Banks.
2) Intense competition which is putting pressure on net interest margins (i.e. income earned from lending)
Revenue for the banks is reported in two ways: interest income (earned from lending) and non-interest income (earned from fees, wealth businesses and markets and treasury operations). At each of these levels, banks can increase revenue in two ways: attacking each other’s market share, and growing along with the entire pie; that is, riding on credit growth in the entire economy.
The chart to the right (from the RBA) illustrates the decline in net interest margin. Net interest margin is also known as “net yield on interest-earning assets.” It is calculated as (Interest Received – Interest Paid) / Average Invested Assets. As a simple example, if somebody borrowed $100k at a 4% interest rate (i.e. $4k per year) to buy a fixed income product returning 6% (or $6k per year), that persons net interest margin is: ($6,000 – $4,000) / $100,000 = 2%.
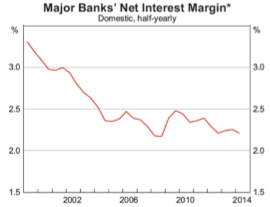
It is no different for the banks. Tom and I take the view that if the Banks can continue to earn over 2% every time they make a loan in this “benign” environment, then they will continue to generate very attractive levels of cash. We are not overly concerned about potential short term volatility in net interest margins. We continue to see the banks as a robust industry generating solid returns.
3) Increased capital requirements will put the brakes on growth
The Australian Prudential Regulatory Authority (APRA) has stated that Australia’s four largest banks will need to carry an extra 1% of core tier 1 capital from 1 January 2016 due to their systemically important status. This is part of Basel III rules to deal with any threat to domestic and regional financial stability. The new capital impost will take the big four Australian banks’ minimum common equity tier 1 capital requirement to 8%, which is already in line with current capital levels at the Big 4.
Many stockbrokers claim that this may dilute earnings per share by 1% to 2%. Rather than getting caught up in short term earnings impacts, we think it more appropriate to view this from a different angle and would argue that a requirement to have more stringent capital rules / buffers is a good thing. As Charlie Munger once said, “an ounce of prevention is worth a pound of cure”.
4) A lack of revenue growth – the improvements in earnings have been largely driven by a reduction in bad debts.
We do concede that one of the key drivers of the strong results by the banks of late has been a decline in bad debts. A recent report from PwC found that about 60% of the improvement in the banks cash earnings has been driven by the reduction in bad debts. The following chart from the RBA is illustrative.
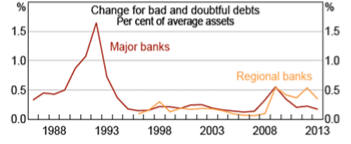
As we noted earlier, we remain comfortable with our position in the banks and believe we are probably at the bottom of the cycle in terms of bad debt provisions. Thus, the thing that would cause us to be more positive on the Banks would be a recovery in credit growth. The banks have been successful of late in cross selling into other areas such as wealth. Nevertheless, in order to drive a material uptick in earnings growth, the banks are highly reliant on credit growth increasing. As Cameron Clyne (CEO of NAB) said “The real kicker for [bank earnings] growth will come from improved economic activity.” Westpac CEO, Gail Kelly, also made an interesting observation when she noted that rising bad debts are “not necessarily a bad thing, because it reflects that there is more lending going on.”
The BKI Investment Approach to the Banks
BKI is focused on investing in stocks using five basic fundamentals as part of the stock selection process. We look to invest for the very long term. Allow us to consider each criteria as it pertains to the major banks through the five investment criteria that BKI uses as part of our stock selection process:
- 1. Income – Dividend Yields, Income Growth, Franking Credits, Payout Ratios
- 2. Principal Activity – Sustainable Business Model, Competitive Advantage
- 3. Debt Levels – Gearing Ratios, Net Interest Coverage, Capital Ratios
- 4. Management and Board – Share Ownership, Board Meeting Attendance, History of Creating Shareholder Wealth
- 5. Earnings and Valuations – Earnings Profiles, PE Multiples, EV/EBITDA Multiples
1. Income
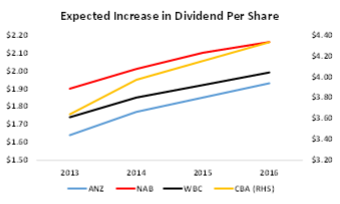
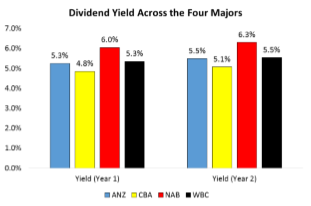
We expect that banks will continue to provide the portfolio with attractive fully franked income growth. The headline dividend yield being offered by the four majors is still superior to most other sectors. Based on the cost price of our four major banks positions, each are providing BKI with a double digit return on a grossed up dividend yield basis. Our cost price on CBA for example is less than $35 (versus current prices of $82) – on a grossed up basis, BKI is receiving a dividend yield over 16% per annum on that cost price.
The following charts summarises a number of the key income attributes that we consider. All four banks have a sustainable dividend payout policy and pay fully franked dividends.
2. Principal Activity
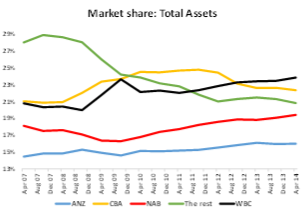
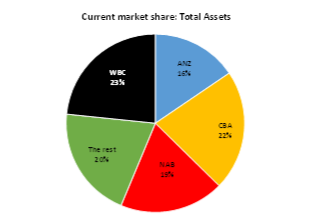
We have covered a lot of the key drivers of banks earnings above. However, we wanted to highlight the following charts which illustrate the power that the four major banks enjoy in Australia. There are 71 banks operating in Australia, yet between them ANZ, CBA, NAB and WBC control 80% of the market. This competitive advantage allows the banks to sell across multiple product lines. The attractive returns on equity (low to mid-teens) support the attractive industry dynamics.
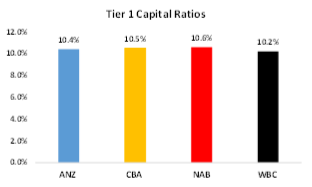
3. Balance Sheet
As discussed earlier, APRA has imposed strict capital requirements for the banks. The chart on the right shows that the banks are in a solid capital position with Tier 1 Capital Ratios all over 10%.
4. Management and Board
Generally speaking, the senior management and Boards of the major banks are exemplary. All display excellent corporate governance and take their board responsibilities seriously. Tom and I consider the four CEOs to be more than capable executives.
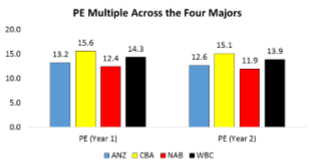
5. Valuation
At current prices, we agree with the consensus view that the banks are reasonably priced. Nevertheless, if confidence returns to Australian businesses and we see a meaningful uptick in credit growth, there is little doubt that bank earnings will be higher.
Despite the strong performance from the major banks in recent years, we are not looking to sell. We do not see the sense in selling and booking profits when companies perform well and hanging on to those businesses that disappoint. Peter Lynch (the successful US investor responsible for a lot of Fidelity Investments success) likens such behaviour to cutting the flowers and watering the weeds.
We continue to believe that the economics of the major Australian banks is compelling. If we look only at the Price-Earnings multiple, we agree with the consensus view that the Banks are looking fully priced. We prefer to invest rather than speculate and would argue that, in the current environment, holding our position in the banks is the best course of action for the BKI portfolio. We expect to earn an attractive fully franked income stream from the banks in the medium to long-term. They are well capitalised, soundly managed, possess a strong competitive position and generate attractive returns.
Based on the cost price of our four major banks positions, each of them is providing BKI with a double digit return on a grossed up dividend yield basis. As noted above, our cost price on CBA for example is less than $35 – on a grossed up basis, we are receiving a dividend yield over 16% per annum. Tom and I know of no other company that can offer such a strong market position, capable management, compelling returns and generate the income for BKI that CBA can. Until we do, why would we sell?
Will Culbert, July 2014